Calibration of 3D-PLI measurements
Background and Motivation
The Three-dimensional Polarized Light Imaging (3D-PLI) technology is used to capture high resolution images of thinly sliced sections of post-mortem brains, using a polarizing microscope. These images, if available in adequate quality, can then be stacked to reconstruct the brain in three dimensions. Such a 3D reconstruction enables tracking of individual nerve fibers through the entire brain.
However, during the imaging process, the quality of each image is affected by different types of effects, such as image noise, e.g., vignetting, irregular illumination, etc. These effects have a direct impact on the reconstruction of the nerve fibers. Therefore a precise calibration of the raw data is important for further processing.
Our approach
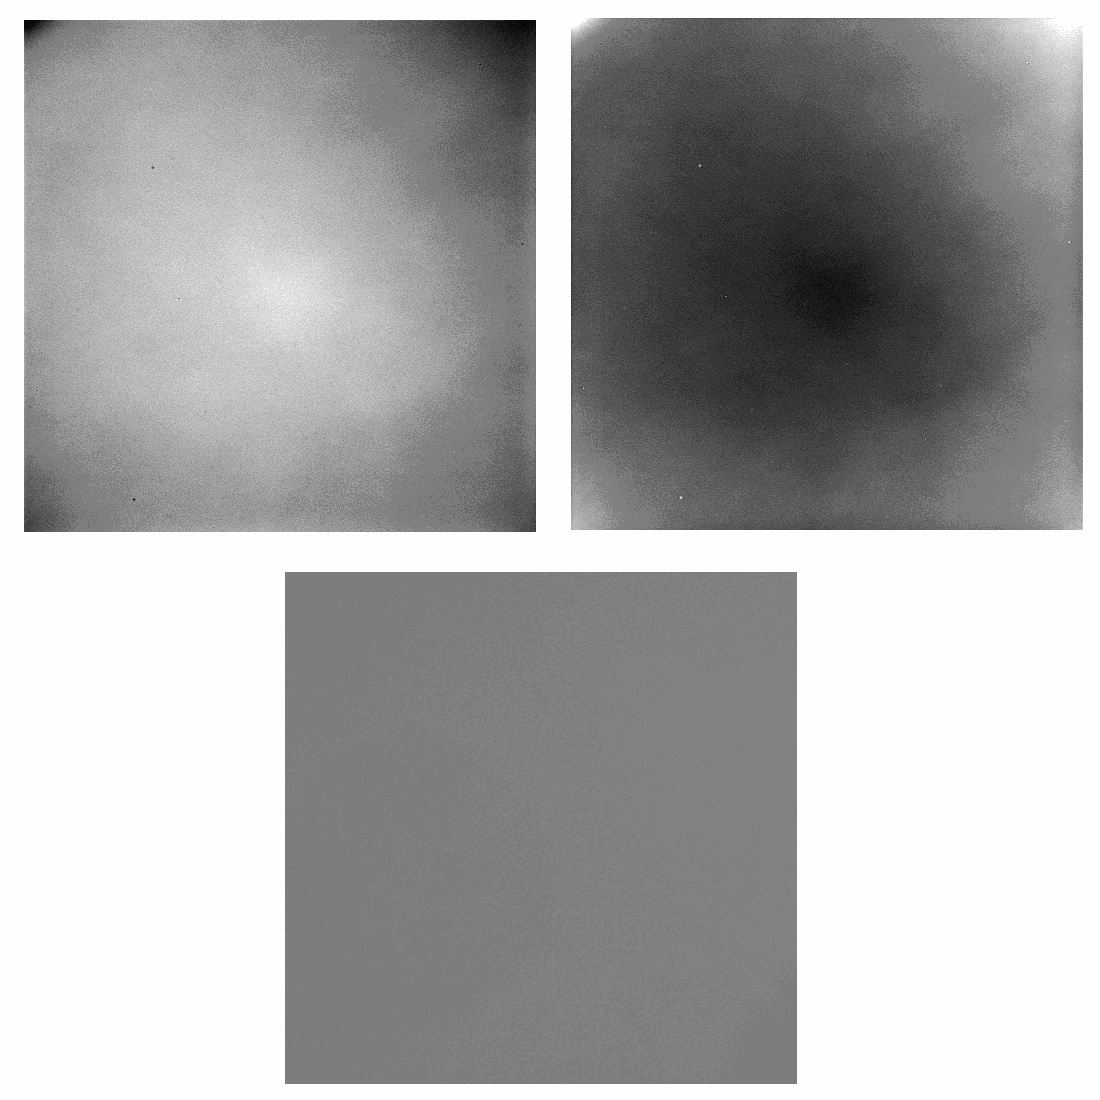
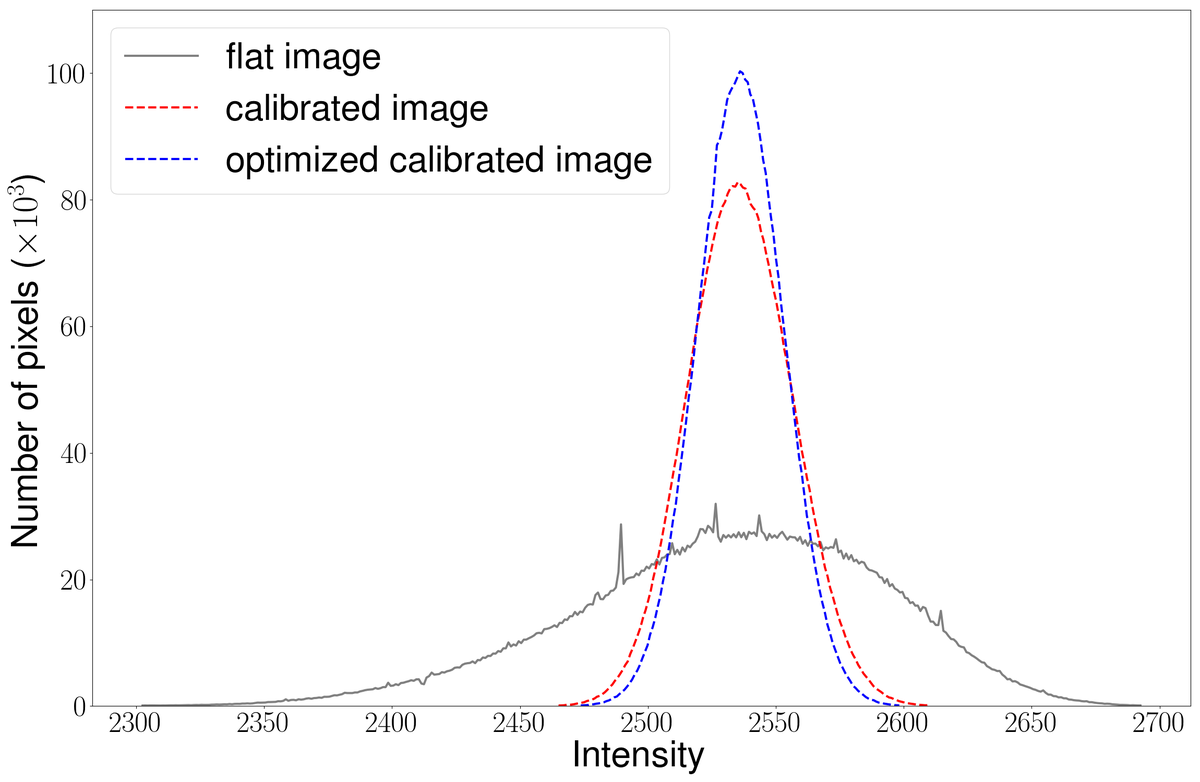
By using flat-field images, i.e., images of the background without any brain tissue, a calibration matrix for 3D-PLI raw data is calculated and applied (see Figure 1). We use statistical methods to reduce the number of required flat-field images to calculate the calibration matrix while maintaining a sufficient level of stability and quality. The results of these improvements are shown in Figure 2.
Furthermore, our tool can continuously update the calibration matrix using flat-field images that are captured before every normal measurement.
Our implementation of the calibration algorithm is parallelized and optimized to minimize the required time-till-solution. The application can utilize the supercomputing resources to significantly increase the speed of the calibration process.
Our collaboration partners
This project is being conducted in collaboration with the Fiber Architecture group of the INM-1.
Related projects at Simulation Laboratory Neuroscience
- Quality assurance for the 3D-PLI workflow
- Using structure tensor analysis to measure PLI image registration quality
Using deep neural networks for identification of brain tissue in very high resolution PLI images