A Microscopic Method for the Evaluating of Continuous Pedestrian Dynamic Models
In this paper, we propose a microscopic method to evaluate continuous pedestrian dynamicmodels at the trajectory level. By comparing the experimental and the simulated trajectoryin four directions, the evaluation of the model can be described by a radar chart, with whichboth qualitative and quantitative conclusions can be obtained. In order to demonstrateour method, we evaluate a social force model by 1,936 trajectories with graded densities in three different scenarios. Three qualitative conclusions are obtained by observing radarcharts of the simulation of the unidirectional experiments. All of them are verified by thecomparison of the macroscopic parameters. Besides, we find that a model with smaller errorin our method always has a better performance at the macroscopic level. At last, the possi-ble quantitative descriptions of the method are discussed. Compared to the evaluations bycomparing collective features like fundamental diagram, our method is general, comprehen-sive and quantitative. The method provides a new possibility to evaluate any continuouspedestrian dynamic model in any scenario with a standard process.
A generalized method is designed to include the following features:
- Independence of the used scenario,
- ability to get rich information from one trajectory,
- insensitivity to the length of trajectory,
- and the evaluated results have a directional physical meaning.
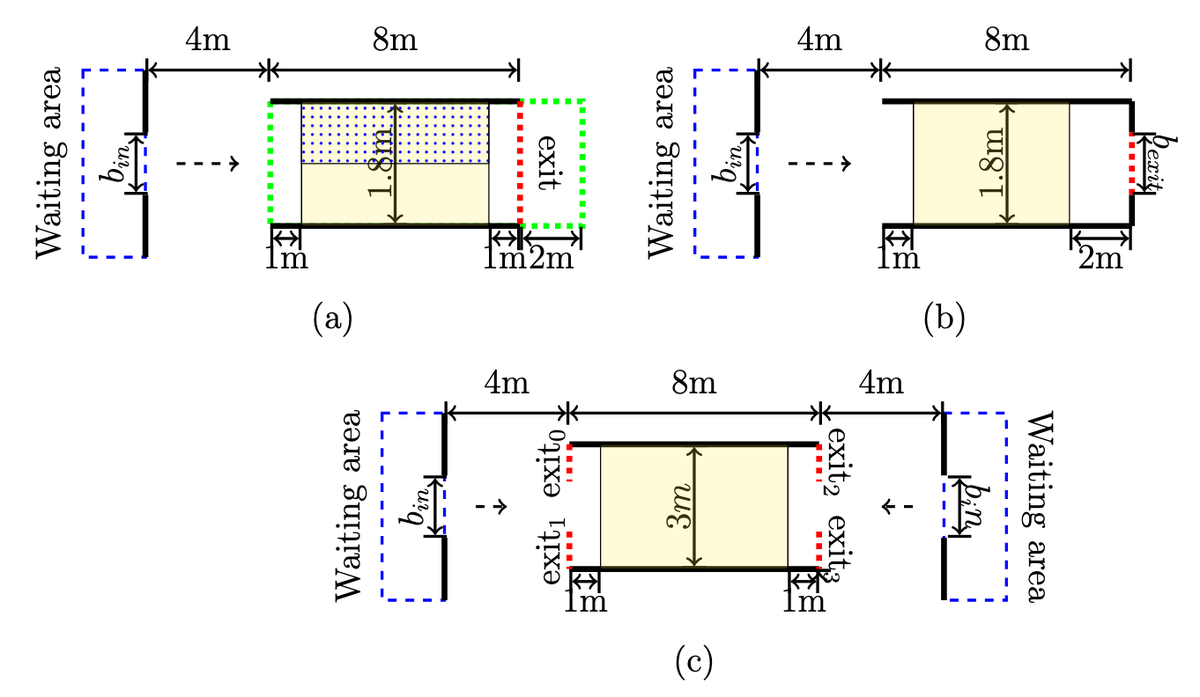
Trajectories used in the evaluation come from Pedestrian Data Archive, which are extracted automatically from video recordings of controlled experiments by using the software PeTrack. Experiments of unidirectional, bottleneck, bidirectional scenarios are involved in the evaluation. Sketches of these scenarios are shown in Fig. 2, in which pedestrians start fromthe waiting area (blue rectangle), then cross the corridor with an expected exit (red dashed line). Density in the corridor is controlled by the width of entrancebinand the number of pedestrians in the waiting area.
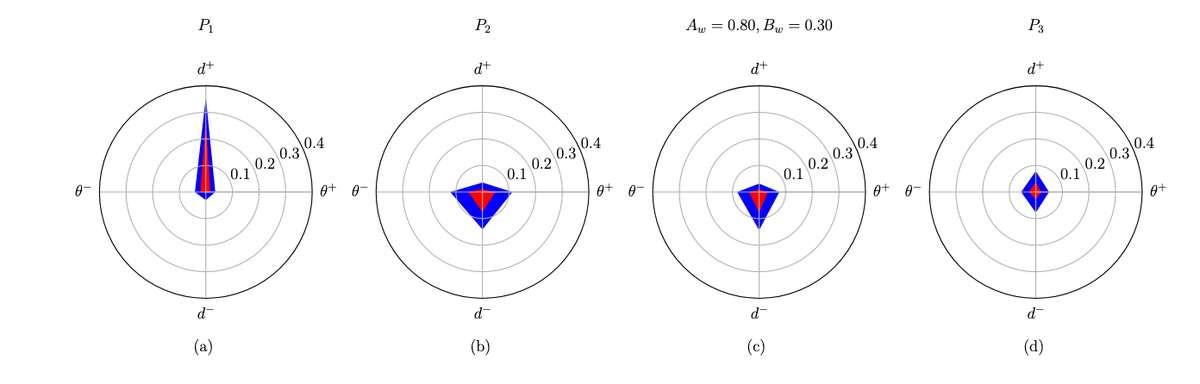
By observing the error charts of a fixed parameter set, we find that the speed in the simulation is much larger than in the experiment, especially in high density situations. The radar chart of shown in Fig. 3, in which the simulated speed is much larger than the actual speed in the experiment. The possible reason could be that the repulsive force between pedestrians is too weak.